
Last week we posted on the basics of organizational charts for proposals. If your team is pursuing a simple, short-term project, a plain vanilla org chart may suffice.
But if the project involves multiple phases stretching over months or years, your team will undoubtedly evolve in response. For this reason, you’ll want to use your org chart(s) to visualize the evolution of your team.
Grouping resources by phase
It may be possible to group the individuals responsible for each phase on the org chart, showing, for example, a design (or solutioning) team, a transition (or implementation) team, and an operations and maintenance team, together with a project leadership team of shared resources. Each team can be grouped within a dotted outline or tint block.
This approach works if there is no overlap between teams. We’ve seen it used in single company proposals for IT and telecom projects.
But for most complex teams, one of the two approaches below is preferable.
Using icons to visualize phases
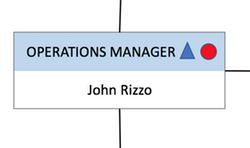 In the case of large, multi-company teams, as in a P3 design-build-finance-operate-maintain project, use icons in key individual boxes to show participation by phase.
In the graphic right, icons indicate the operations manager will be part of the operations and maintenance team but will also participate on the design-build team to advise on issues of lifecycle and maintainability. A key on the chart would link the icons to their respective phases.
This approach has its limitations, which is why most large project RFQs allow for multiple org charts. Take advantage of this, using the approach below.
Using multiple org charts
For complex teams and when page limits allow, include a high-level chart, followed by one for each phase. When non-applicable key individuals and activities are included for context in a phase-specific chart, fade these out using increased transparency in areas containing those KIs/activities.
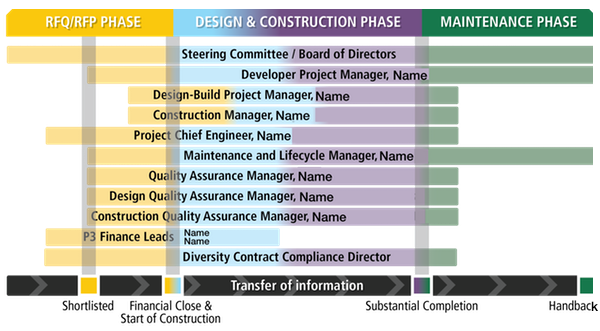
Showing overlap between phases
On large infrastructure projects, issuers are understandably concerned that handoffs between phases will go smoothly with no loss of information and momentum. Reinforce your intent to address this issue by showing key individuals involved across multiple phases with a graphic like the one below.
Bottom line
Take advantage of org charts to give evaluators confidence that you have, not just the experience and team needed to succeed, but also a clear understanding of the project’s phases and an organizational plan to perform the work and manage the risks across all phases.
Photo credit
