
Many RFQ and RFP responses today are page limited. This constraint challenges proponents to summarize and showcase their strengths while using as little narrative space as possible.
How, for example, do you express your team’s experience and joint working history, or what your reference projects have in common with the one on offer, as compactly as possible?
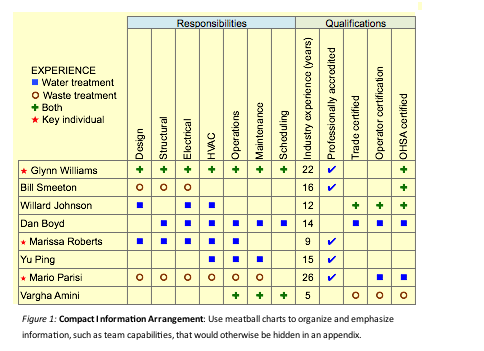
Enter the meatball chart
One solution is a matrix with symbols indicating values where rows and columns intersect. We’re guessing here, but “meatball” likely comes from the popularity of dots as the symbol of choice.
In fact, you’re not limited to one symbol. As in the example above, you can use various symbols to represent different results—but we recommend a limit of four to avoid confusing readers.
Typical uses
This chart type is ideal for summarizing proposed team competencies and relevant experience. But they have other uses too.
Proposed team: You may have an appendix of well-organized team member resumes, but a meatball chart lets you provide a compact summary. The choice of axis is up to you—one is to use rows for team members and columns for capabilities and credentials as in the example above. You can also use a meatball chart to show how many key individuals in a joint venture project have worked together in the past.
Relevant experience: Most bid requests ask for the bidder’s experience with similar projects. In this case put past projects on one axis and key success criteria on the other.
Other: We have seen meatball charts used to compare features when explaining solution tradeoffs or pricing models and to ghost other procurement options. Keep this format in mind whenever you need to make comparisons or show relationships among multiple data points.
Plan before building
It’s not easy to build a meatball chart that tells the story without confusing the reader. You need to consider compliance requirements, client issues and the content. It’s easy to begin building a chart, only to find a different presentation is needed. We find a brainstorming session is a good place to start. Sketch out options until you find one everyone agrees is clear, and then flesh it out and circulate for feedback.
Include a selling caption
A meatball chart is like any other visual; it needs a selling caption to be complete. Give your caption a figure number, results-focused headline and a benefits-oriented statement that delivers the “What’s in it for me?” message you want evaluators to take away.
Busy evaluators will thank you
Meatball chart construction isn’t easy. It takes a lot of thought—and often a few false starts—to find an elegant way to present your information. But both detail-oriented evaluators and senior reviewers will appreciate any effort you make to aggregate information.
And having evaluators appreciate you is always good.
