
Visualizing key aspects of your solution is a powerful way to engage evaluators and help them remember your key strengths and benefits.
Many bid teams get excited about this idea, and then fail to make it happen because of process. And that’s unfortunate–because bidders on huge, highly competitive RFPs devote generous amounts of their precious narrative space to visualizations.
How to build rich visualization into your proposals
Begin by developing a strategy for winning the competition, using ideas from this post on preparing for the proposal kickoff meeting.
At the kickoff, stress the aim of increasing visualization as a way to improve evaluator interest and impact. Ask the section leads to introduce their content teams to the following process:
- Brainstorm ways to show each main idea you want to express. Consider all visualization options—graphs, charts, tables, photographs, illustrations, diagrams, etc.—and choose the one best suited to the information you want to convey. The first time you do this, consider Googling samples and make a slide show or print and post them in the room as thought-starters.
- Decide on the rough width and depth of each proposed graphic. Sketch out or describe each one (e.g. graph showing 5-year decline in backorders) and draft a caption containing the benefit to the prospect, so the illustrator can understand the graphic’s purpose.
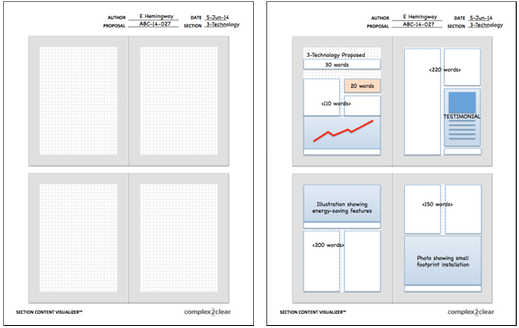
- Use a section content visualizer (Figure 1) to block out the section pages, reserving space for text and the proposed graphics. Estimate the word count, based on the available column inches. Click on this link to download C2C’s Section Content Visualizer (236 KB PowerPoint file).
- Use the content visualizer as a guide to copy length. NOTE: Avoid the temptation to repeat information in the visualization in the copy.
 |
|
Figure 1. Engage evaluators with rich visualization: Use the Section Content Visualizer (above left) to reserve space and define graphics as part of your strategy process. Completed storyboards for four pages are shown at right. |
Following this process dramatically improves efficiency. It gets the visualization process started immediately instead of making it a last-minute rush.
Equally important, it avoids wasting writer energy describing features and benefits better illustrated with a graphic. Few things frustrate writers more than sweating over copy—only to see it cut to make way for graphics that could have been planned in advance.
How much visualization is too much?
We’ve had clients say, “The RFP only allows six pages for this section. Can we really use up space on graphics?”
The answer is “YES”—provided the graphics express important ideas and don’t simply decorate the page. In fact, replacing half a page of explanation with a one-third page graphic containing the same information saves space and adds impact. Visualization should save space, not compete for it.
Here’s evidence: Complex2Clear has supported teams bidding for contracts worth billions of dollars. These teams follow the process described above—and some aim for a 50% ratio of graphics-to-text—even in page-limited proposals.
Are your proposals nearly all text? Use the ideas above to improve impact and win rate.
